Trump’s Investment Claims: 9.5, 17, or 18 Trillion Dollars?
U.S. Bureau of Economic Analysis. 2026. "Foreign Direct Investment in the United States: Net Inflows 2015–2024." International Transactions Accounts Data. Washington, DC: U.S. Department of Commerce. https://www.bea.gov/data/intl-trade-investment/direct-investment-us.
(Analysis Provided by Google Gemini)
Recent fact-checks and economic analyses of Donald Trump’s claim of $17 trillion (and more recently $18–21 trillion) in new investments indicate that the figure is a significant exaggeration that lacks supporting evidence from official economic data.
Fact-Checking the $17 Trillion Claim
Fact-checkers from organizations such as PolitiFact, CBS News, and the Cato Institute have labeled this claim as "false" or "unsupported." The primary reasons for these ratings
Scale of the Claim: $17 trillion is nearly 60–70% of the entire U.S. GDP ($28.78 trillion in 2024). For that amount to be "invested" or "brought in" within a single year or term, the U.S. would have to see a capital explosion unprecedented in world history, far outstripping the New Deal or the 19th-century railroad boom.
Official Inconsistencies: The U.S. Bureau of Economic Analysis (BEA) and the Treasury Department have reported no data showing inflows anywhere near this magnitude. Total Foreign Direct Investment (FDI) typically ranges between $150 billion and $500 billion annually.
Announcement vs. Reality: Many "commitments" are actually non-binding press releases. Analysts have found that these lists often include projects that were already underway, domestic investments by U.S. firms (like Microsoft or Apple), or simple trade deals (like purchasing Boeing planes) rather than actual capital investment in U.S. infrastructure.
Origins of the $17 Trillion Figure
The number appears to have originated from a White House "Investment Tracker" (often referred to as the "Trump Effect" list) established in 2025.
The $9.6 Trillion Base: Initially, the White House published a list claiming roughly $9.6 trillion in "private and foreign investment" announcements.
Inflated Metrics: Analysts at Bloomberg Economics and the Cato Institute noted that this list included domestic investments from U.S. companies (which are not "overseas sources"), R&D spending by pharmaceutical firms, and even simple procurement contracts.
Doubling the Claim: By late 2025 and into his 2026 State of the Union, Trump began citing $17 trillion and then $18 trillion. Critics suggest this was achieved by "doubling down" on the existing $9.6 trillion list—counting the same projects twice or adding speculative "commitments" from foreign governments (like Saudi Arabia or the UAE) that have not materialized as actual cash flows.
Annual Net Foreign Investment (FDI) in the US (2015–2024)
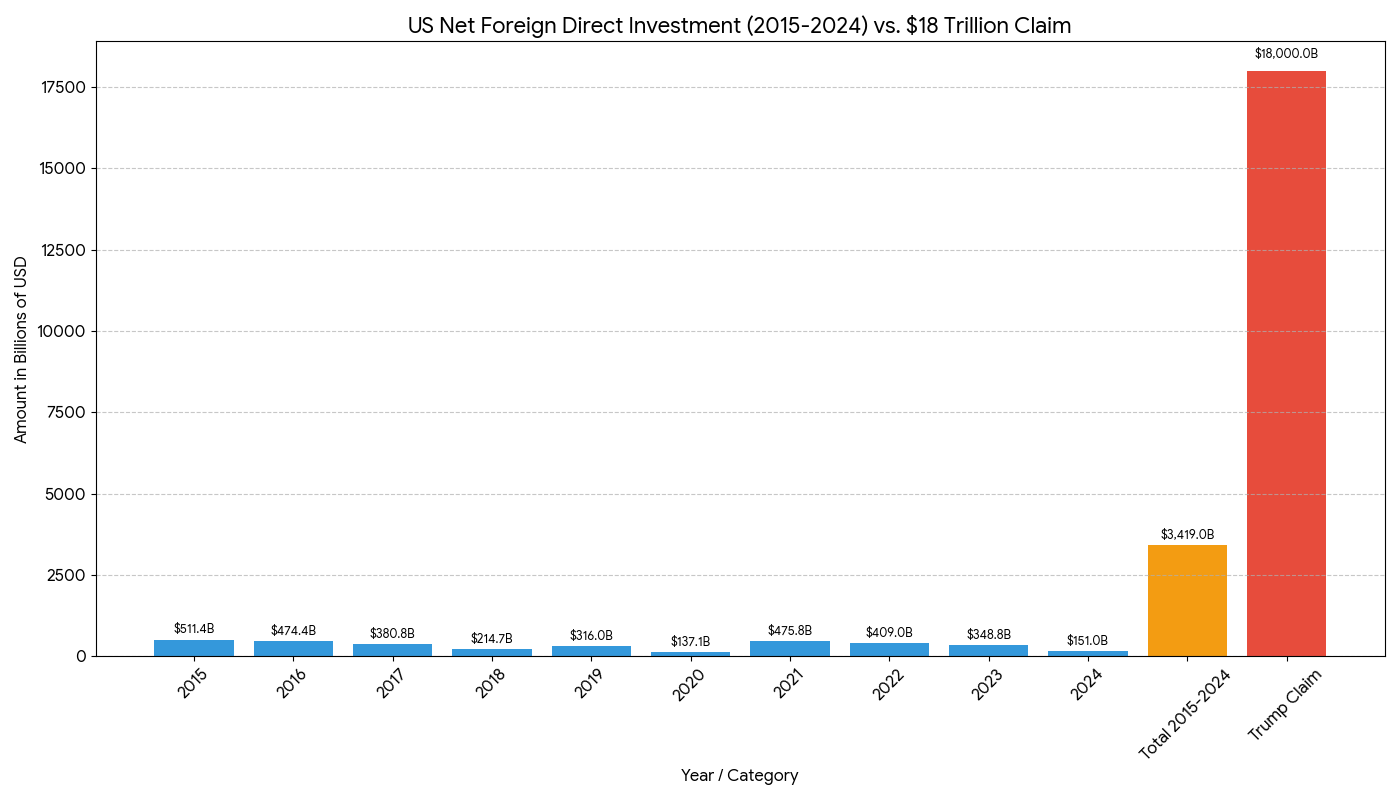
To put the $17 trillion claim in perspective, here is the actual Net Foreign Direct Investment (FDI) into the U.S. over the last 10 years, according to BEA and UNCTAD data. These figures represent the actual "new" money entering the U.S. economy from overseas.
Yearly Net Foreign Direct Investment (Inflows +)
Year Net Foreign FDI President at the Time
2009 $161.1 Billion Obama
2010 $264 Billion Obama
2011 $263.5 Billion Obama
2012 $250.3 Billion Obama
2013 $288.1 Billion Obama
2014 $251.9 Billion Obama
2015 $511.4 Billion (Historical Peak) Obama
2016 $474.4 Billion Obama
2017 $380.8 Billion Trump
2018 $214.7 Billion Trump
2019 $316.0 Billion Trump
2020 $137.1 Billion (Pandemic Low) Trump
2021 $475.8 Billion Biden
2022 $409.0 Billion Biden
2023 $348.8 Billion Biden
2024 $151.0 Billion (Prelim. Est.) Biden
Source: U.S. Bureau of Economic Analysis. 2026. "Foreign Direct Investment in the United States: Net Inflows 2015–2024." International Transactions Accounts Data. Washington, DC: U.S. Department of Commerce. https://www.bea.gov/data/intl-trade-investment/direct-investment-us.
Net Foreign Direct Investment (FDI) Trends (2009–2024)
Period Trend Summary 0f Average Annual FDI
Obama (2009-2016)Gradual recovery from the Great Recession, peaking at a historical record of **$511.4B** in 2015.~$309 Billion
Trump 1st Term (2017-2020)A general decline in net inflows, exacerbated by the 2017 Tax Cuts and Jobs Act (which encouraged repatriation rather than new inflows) and the 2020 global pandemic.~$262 Billion
Biden (2021-2024)A sharp post-pandemic rebound in 2021 and 2022, followed by a cooling period in 2024 due to global interest rate hikes.~$346 Billion
Acquisition vs Greenfield FDI
The distinction between Acquisition (Mergers and Acquisitions/M&A) and Greenfield investment is the difference between buying a house and building one. While both involve significant capital, their impact on the "neighborhood" of the U.S. economy is fundamentally different.
1. Acquisition FDI: "The Change of Hands"
Acquisitions represent about 94% of foreign investment in the U.S.
Manufacturing Output: Usually stays stable in the short term. The factory is already there; only the logo on the front gate changes.
Employment: Primarily a transfer of existing jobs. It is a net-neutral event for the national labor market.
Economic Effect: It brings in foreign capital and often introduces new management techniques or global supply chain access. However, "synergies" after a merger often lead to corporate consolidation and potential layoffs in administrative or overlapping roles.
2. Greenfield FDI: "The Groundbreaker"
Greenfield investment—building brand-new facilities—accounts for only about 6% of FDI but is the "holy grail" for economic development.
Manufacturing Output: Directly increases the nation’s productive capacity. It adds new machines, new assembly lines, and new taxable infrastructure that did not exist before.
Employment: Creates net new jobs. Every hire at a new greenfield site is an addition to the total U.S. workforce.
Economic Effect: These projects have a high "multiplier effect," stimulating local economies through construction contracts and new demand for local services.
Summary of Impact on U.S. Manufacturing
FeatureAcquisition (M&A)GreenfieldManufacturing CapacityRedundant (Already exists)Expansionary (New capacity)Immediate Job ImpactNet-Neutral (Reclassification)Net-Positive (New hiring)Typical GoalMarket share & Brand acquisitionProduction & Logistics expansionCommon ExampleAnheuser-Busch being bought by InBevToyota building a new plant in Alabama
The Bottom Line
If a political claim cites "trillions in investment," it is almost certainly a tally of Acquisitions (where money is essentially swapped for existing assets) rather than Greenfield projects (which actually grow the industrial base). While M&A keeps the economy liquid and integrated, only Greenfield investment truly moves the needle on U.S. manufacturing output and total employment.
Sources
Know the Facts: Trump's claims on the economy, war and affordability - MS NOW
Fact-checking Trump's false claims ahead of the State of the Union | PBS News
Know the Facts: Trump's claims on the economy, war and affordability - MS NOW
Trump's $18 Trillion Fantasy - Cato Institute
Trump's Eighteen Trillion Dollar Hoax | Cato at Liberty Blog
Trump's Eighteen Trillion Dollar Hoax | Cato at Liberty Blog
Foreign Direct Investment in the United States 2025 - GBA - Global Business Alliance
Greenfield Investment - Definition, Advantages and Disadvantages